June 15, 2026 · News
Splunk ITSI & AIOps: What a Solution Brief Looks Like in the Field
There's a strong Splunk ITSI & AIOps solution brief circulating in Türkiye's Splunk ecosystem lately, prepared by Splunk Staff Solutions Engineer Ali Çetin. It positions ITSI as an umbrella layer above your monitoring tools, names the three core problems of a siloed telemetry ecosystem, and explains how AIOps works through an Observe → Engage → Analyze → Act → Learn loop.
This article is that narrative meeting the field. Because we lived the three problems and the loop the brief frames, one to one, in a real ITSI POC we ran at a public-sector institution in 2023. The short version: if the infrastructure is already there, visibility is much closer than you think.
The brief's three problems, three pains in the field
The solution brief lists three problems of a siloed telemetry setup. When we started the POC, the customer's situation was exactly the live version of all three:
- Data Silo
- Each tool produced and stored its data in isolation; there was no shared visibility into the system as a whole. The customer had Splunk Enterprise and Enterprise Security, logs were flowing — but there was no single health indicator at the service level. The data was there; the visibility was not.
- Lack of Correlation
- When a service slowed down, the team ran manual, lengthy investigations to find the root of the problem (was it infrastructure, the network, a dependency?). As load grew, services slowed and outages occurred, and root-cause analysis took hours for every incident.
- Alarm Fatigue
- Dozens of alerts tied to the same root cause made it hard for the team to tell apart the "real problem." Operational efficiency was being crushed precisely under this noise.
In other words, the brief's abstract framing mapped to a very concrete pain in the field.
The solution: not from scratch, but on top of the existing investment
The customer already had Splunk Enterprise and Enterprise Security. The infrastructure was in place; what was missing was the operational visibility layer. As DataVira, we positioned an ITSI POC on top of the existing investment.
The brief's emphasis on "Any Data, Any Source" and "centralized metric / log / trace" turns into a technical reality exactly at this point. The architecture below separates the "existing setup" from "what was added within the POC":
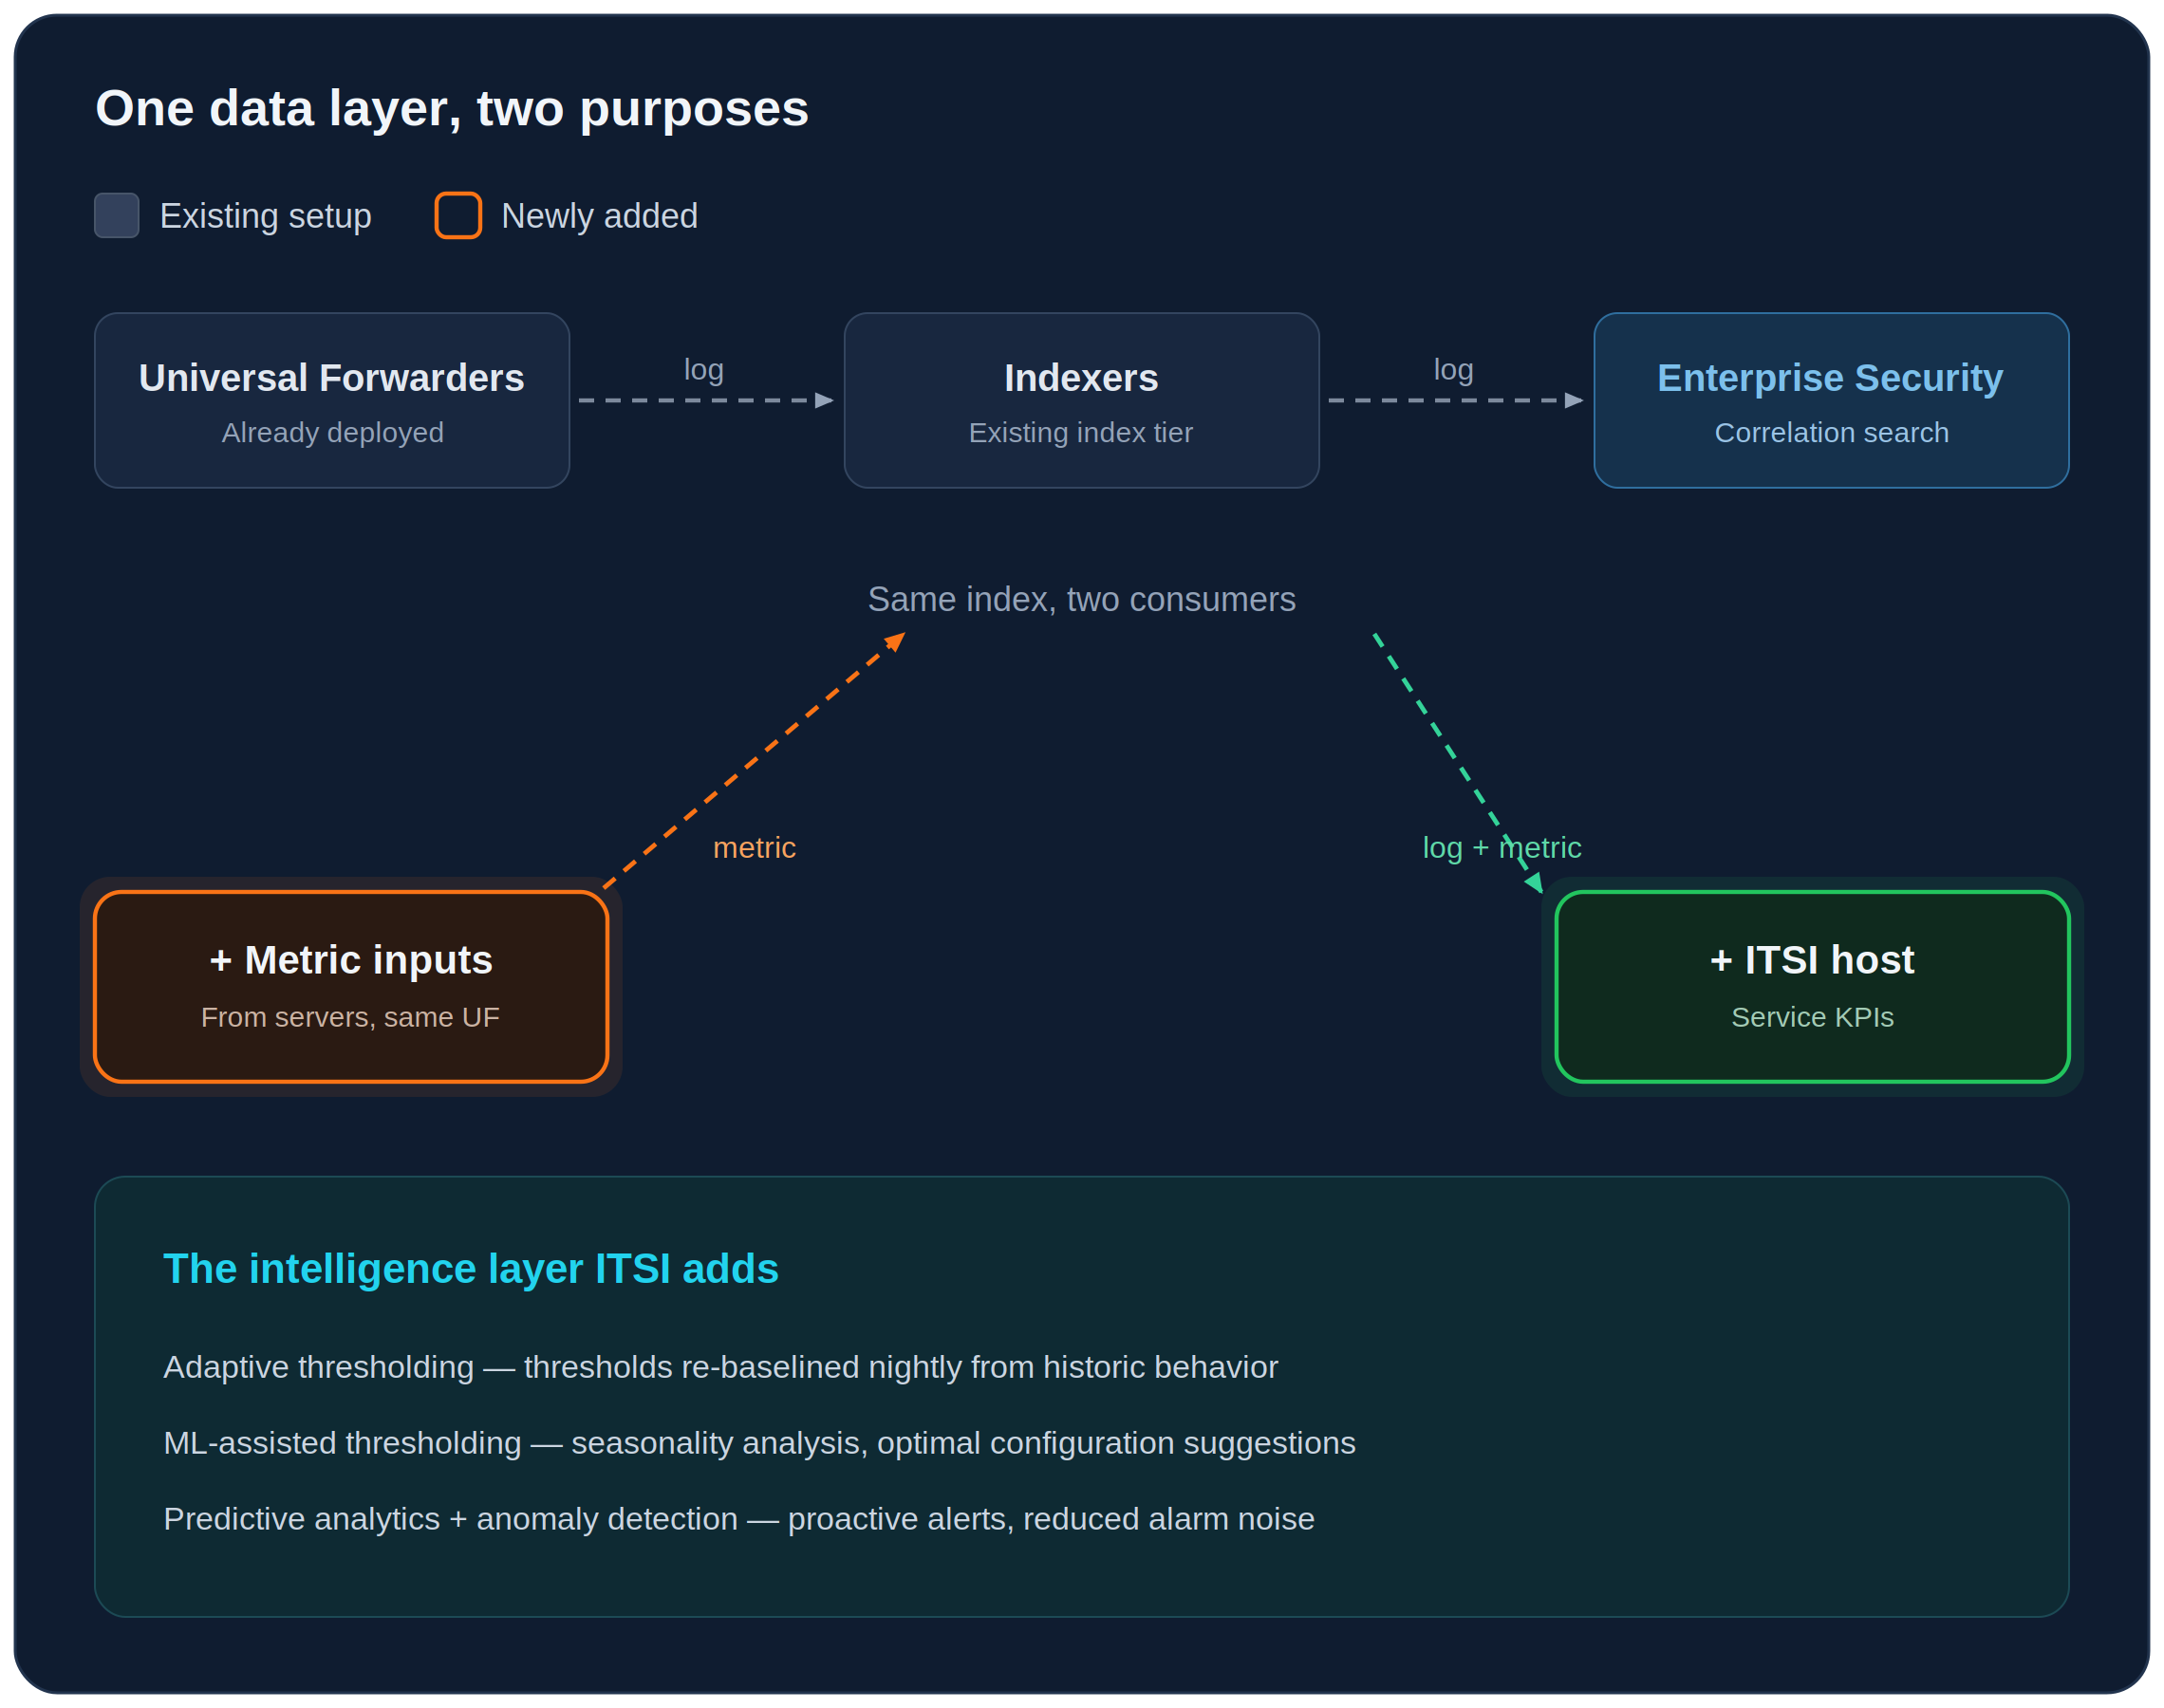
The critical point this diagram makes is this: zero additional collection layer.
- The Universal Forwarders in the field were already deployed, and logs were already flowing to the indexers.
- Metric inputs from the servers could be added to this data — collected for SIEM purposes — over the same UF infrastructure, without installing any new agent.
- The same raw event feeds a correlation search on the Enterprise Security side and turns into a service KPI on the ITSI side.
In a separate monitoring stack you would have had to collect the same data a second time, manage separate agents and keep two different data pipelines in sync. On Splunk, a single index layer serves both consumers at once.
Within the POC we implemented a single service, and only partially at that. Because the KPI base searches were defined over existing indexes, entity discovery and service setup moved quickly. Even in this narrow scope, several previously unnoticed problems were identified and fixed. It was exactly at this stage that the DevOps and systems-operations team adopted the product.
How the brief's loop played out in the POC: Observe → Engage → Analyze → Act → Learn
The solution brief describes AIOps as a five-stage loop. Our POC was narrow in scope, but it clearly showed how each stage of this loop takes concrete form:
- Observe
- Centralizing metric, log and trace data across service networks. For us this happened by adding metric inputs to the existing UF infrastructure, with zero additional collection.
- Engage
- ML-based baseline learning for behavioral deviations. ITSI's adaptive thresholding re-baselined historic KPI behavior every night and adjusted thresholds to load that changes hour by hour. The false alarms produced by traffic naturally dropping at night were largely eliminated. Details: Create adaptive KPI thresholds in ITSI.
- Analyze
- Smart grouping and noise reduction with Event IQ; catching abnormal deviations with anomaly detection. This is a direct answer to the brief's "Alarm Fatigue" problem: once the alarm noise was cut, the team could focus on actual business impact.
- Act
- The self-healing direction through automated runbooks and ITSM integrations. We did not fully enable this stage within our POC, but we showed that the architecture is open to it.
- Learn
- Continuous improvement through operator feedback loops. Recomputing the adaptive baselines every night let the system become more accurate over time.
ITSI's real value: not in the dashboards, but in the ML layer
ITSI's visible face is the Service Analyzer — the screen that shows services' 0-100 health scores as color-coded tiles. You can review this view in Splunk's official documentation: Overview of the Service Analyzer in ITSI.
But the real lesson the POC left me with, as the brief also stresses, was that ITSI's value lies not in this visual layer but in the machine-learning layer beneath it.
ML-assisted thresholding
Adaptive thresholding adjusts thresholds automatically; one step further is to leave the threshold configuration itself to the machine. ML-assisted thresholding analyzes the seasonality and patterns in the data and recommends an optimal threshold configuration for each KPI. Manually tuning a KPI used to be a half-day job requiring visual analysis and guesswork; this feature brings it down to seconds. You can apply the recommendation as-is or fine-tune it yourself — the flexibility is not lost. Splunk documentation: Configure KPI thresholds with machine learning in ITSI.
Predictive analytics
This is the most striking capability on ITSI's AI side: analyzing historic service health scores and trends/patterns to foresee likely service degradations in advance. In Splunk's own words, predictive analytics can predict incidents 30 minutes ahead with machine-learning algorithms. This turns operations from reactive to proactive — like scaling resources before a CPU spike reaches the service. Splunk documentation: Overview of Predictive Analytics in ITSI.
Service Tree and deep dive
What the brief calls the "Service Tree topology" is decisive in root-cause analysis. A problem in a lower component is immediately reflected in the parent service's health score, so the root cause narrows down within seconds, from application to infrastructure. And to deepen root-cause analysis, deep dives let you place multiple KPIs side by side in a swim-lane view and correlate them over time — this is the tool that directly lowers MTTR. Splunk documentation: Overview of deep dives in ITSI.
Conclusion: the brief built the theory, the field proved it
The POC's outcome was clear: using ITSI, service quality went up and MTTR dropped noticeably. But more importantly, because the customer had already invested in Splunk as a SIEM, adding ITSI was far more efficient — in both cost and technical terms — than acquiring a separate AIOps product from scratch.
The data was already there, the forwarders were already in place, the platform was already managed. The only thing added was the operational-intelligence layer on top of that data.
The ITSI & AIOps narrative the solution brief tells is accurate and strong. The only thing we added is proof that this narrative truly works in the field. If you run Splunk as a SIEM, it makes sense to see ITSI not as a separate product but as the next step of the same investment. Visibility is often just a POC away.
DataVira is Türkiye's Splunk-focused Elite Partner. If you'd like to talk about our field POC and production experience with Splunk architecture, Enterprise Security and ITSI, you can reach us at datavira.com.
The sources linked for the ITSI screen views belong to Splunk's official documentation.
Contact: [email protected]